video: Big tech has been one of the few engines driving the market and it seems to be slipping just a bit - Michael Kahn, CMT
Month: December 2015
Technical Analysis: Market Looks Similar to 2007
video: The chart structure for the “average” stock looks a lot like it did in 2007/2008. - Michael Kahn, CMT
Technical Analysis: Nike’s Rejection
video: Nike soared on earnings only to close in the red. That is the definition of failure and the market’s rejection of good news. - Michael Kahn, CMT
TraderMinute: Playing the Bounce on COP
Every week, our friends at TraderMinute provide insight into some interesting opportunities in the markets based on the technical analysis techniques that they use in their 100K Challenge®. Visit TraderMinute.com to learn more about their live educational video training series. Follow this link to access a 30-day free trial.
There is no denying that oil has been taken to the wood shed this year and absolutely beaten down. None of the major oil stocks have escaped the wrath that has settled in on the sector. Everything from Chevron (CVX), Schlumberger (SLB), Halliburton (HAL), and Exxon (XOM).
You can see the damage that has been done if you take a look at the Energy SPDR (XLE), which started 2015 on the highs around $82 and now has sunk to below $60, a little over 25% value this year.
While agonizing to watch the price of these company’s slide, the silver lining is that with bottoms come opportunities.
Take ConocoPhillips (COP) as an example. A couple of things have developed that make it an attractive opportunity to jump on as the year comes to a close. A few developments have happened recently that make this a potentially great opportunity.
First, the option activity on the call side has increased. There was a rather large purchase today in the tens of thousands for the January 50 Calls and the volumes in those options spiked indicating it is new money. The long calls allow the purchaser to buy the stock at $50. Essentially the purchaser is banking on a rally that might have COP well above $50 by mid-January.
Second, it’s beginning to find a level of support at $45 and is showing that is pretty oversold. In fact, compared to the stretch at the end of 2014 to March 2015, (COP) was oversold at $61 and then bounced up to around $70.
If you decide to trade it, the target is around the November highs of about $55. If the stock and oil takes a nosedive, the support level at $45 is a great stopping point.
TraderMinute was founded by Jeff Yaede with the purpose to help option traders manage risk and earn more through the 100K Challenge®. Jeff has successfully achieved taking $3K to $100K multiple times, in just 4 months or less, by using the TraderMinute proprietary signals (Vibe,TrendRider, and 3/7 Ignitor) for his trade entries & exits.
Every day Trader Minute 100K Challenge traders host the Live Trade Seat from market open to market close where community members have the opportunity to interact with them and other traders via live chat.
All members can participate in the 100K Challenge by following their trades in real time streaming on the Live Trade Seat which include trade, Twitter and email alerts. Community members also receive in-depth market insights and trade signals through the TMVibe Newsletter.
Technical Analysis: Chipotle Mexican Grill (CMG)
video: With all the lousy news out concerning the company, is there anything we can see technically on the charts? You bet there is. - Michael Kahn, CMT
Technical Market Analysis - Auto Retailers Sinking
Guest Post: Scott Carney and the Harmonic Pattern Collection for ChartIQ
Harmonic trading pioneer Scott Carney explains the trading methodology and how to use the new Technician toolkit. Learn more about the Harmonic Pattern Collection toolkit for Technician and try it free for free for 14 days here.
The Official the Harmonic Trading Software for ChartIQ
Over the past decade, harmonic patterns have become one of the most popular technical tools used by traders today. Created as a part of the Harmonic Trading methodology, these patterns identify important structural signals unlike any other strategy. I introduced harmonic patterns in my first book, “The Harmonic Trader” (1998) and defined the rules that validated these structures as profitable opportunities. Back then, advanced software technology was only starting to emerge. In fact, I initially measured all structures by hand and had to sift through hundreds of charts a day to find excellent opportunities. Now, in partnership with Divergence Software, we have developed the official the Harmonic Trading software for ChartIQ. The end result of our collaboration produced an effective program that correctly measures and defines the best structural trading opportunities based upon harmonic patterns.
The Harmonic Pattern Collection for ChartIQ makes Harmonic Trading easy, as it automatically scans and identifies trading opportunities, doing all of the work for you. The program illustrates the measurements and defines the critical levels of harmonic support and resistance as defined by these structures. The software can scan for all harmonic patterns at once or individually as selected. The AB=CD, Alternate AB=CD, Bat, Alternate Bat, Butterfly, Crab, Gartley, 5-0, Shark pattern alignments were defined in “The Harmonic Trader” and “Harmonic Trading Volume 1&2”and programmed according to these optimal specifications. Harmonic patterns are extremely effective but must be measured properly and managed effectively to optimize their profitability.
One of the simplest structures within the Harmonic Trading approach is the AB=CD pattern. The Harmonic Pattern Collection’s AB=CD scanner identifies structures that possess ideal symmetry and proper ratio measurements to define those opportunities with the highest probability for profit. AB=CD patterns define important harmonic zones of support and resistance that provide defined price levels for trade executions. The following chart shows an excellent example of this pattern in the EURUSD.
Eurodollar (EURUSD): 5-Minute Bearish AB=CD
The following chart shows an ideal Bearish AB=CD pattern. This structure is quite common and frequently identifies excellent intraday trading opportunities. The Harmonic Pattern Collection automatically measured, labeled and alerted an excellent potential opportunity. After a sharp rally earlier in the session, the software identified the precise harmonic resistance as defined by the structural measurements.
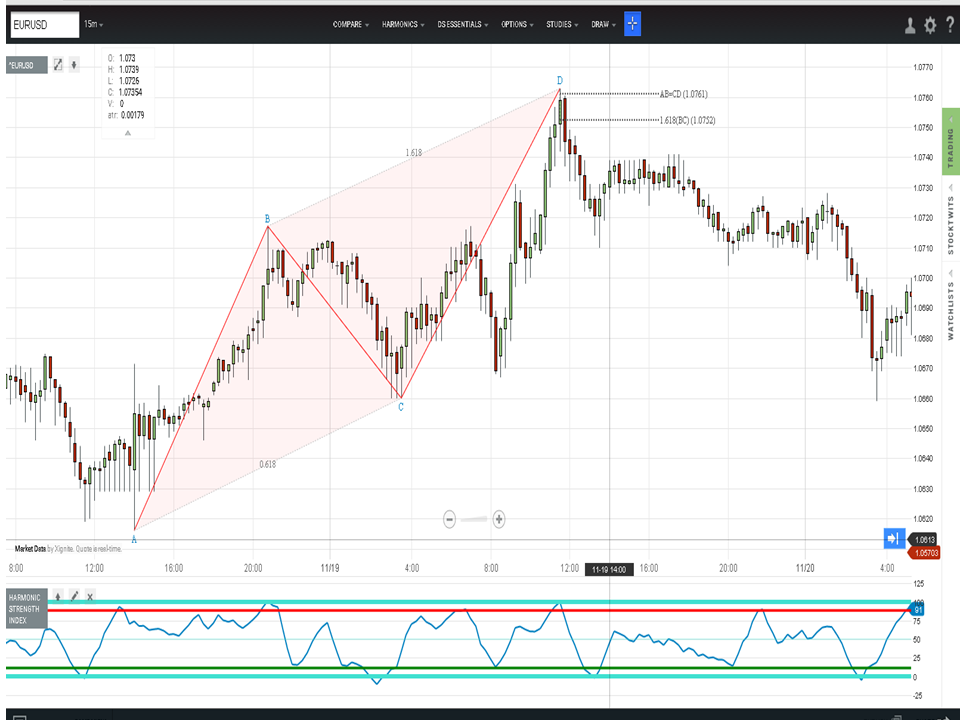
The intraday pattern was nearly 200 pips in length but defined a precise zone that was approximately within a 10 pips range between 1.0751-1.0762. Immediately after testing this harmonic support, the price action reversed at the exact pattern completion point. By the next day’s session, the price action reversed 150 pips.
Eurodollar (EURUSD): 5-Minute
Bearish AB=CD Potential Reversal Zone (PRZ)
It is important to note that the Harmonic Pattern Collection employs only those measurements that match the correct structure. The following chart shows the price action in the Potential Reversal Zone.
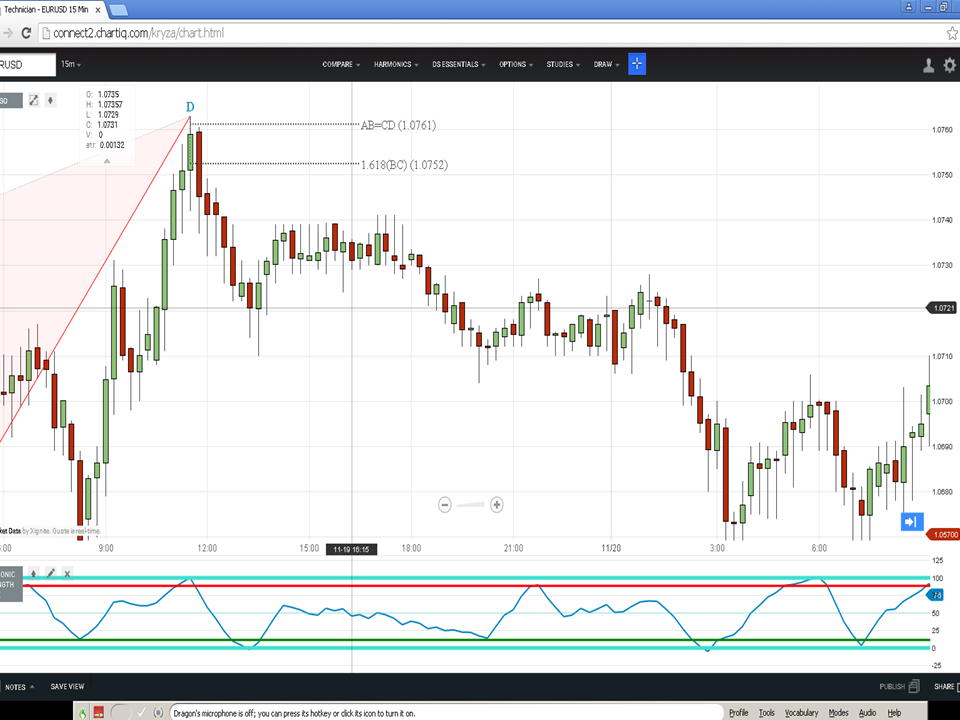
Bearish AB=CD Potential Reversal Zone (PRZ)
The ChartIQ platform possesses many excellent technical tools that can be integrated with the Harmonic Pattern Collection to confirm trade opportunities effectively. One of the primary indicators utilized within the Harmonic Trading approach is the new Harmonic Strength Index (HSI).
Eurodollar (EURUSD): 5-Minute
Bearish AB=CD Potential Reversal Zone (PRZ) with HSI
Referring to our example of the Euro, the harmonic resistance as defined by the pattern was complemented by an Overbought HSI reading. When price action reverses at the completion of a harmonic pattern with a technical reading such as HSI, the probability of a profitable trade increases immensely. In this intraday example of the Euro, the Harmonic Strength Index (HSI) reading tested the Overbought level (+88.6) simultaneously as it reversed from the Potential Reversal Zone of the AB=CD pattern.
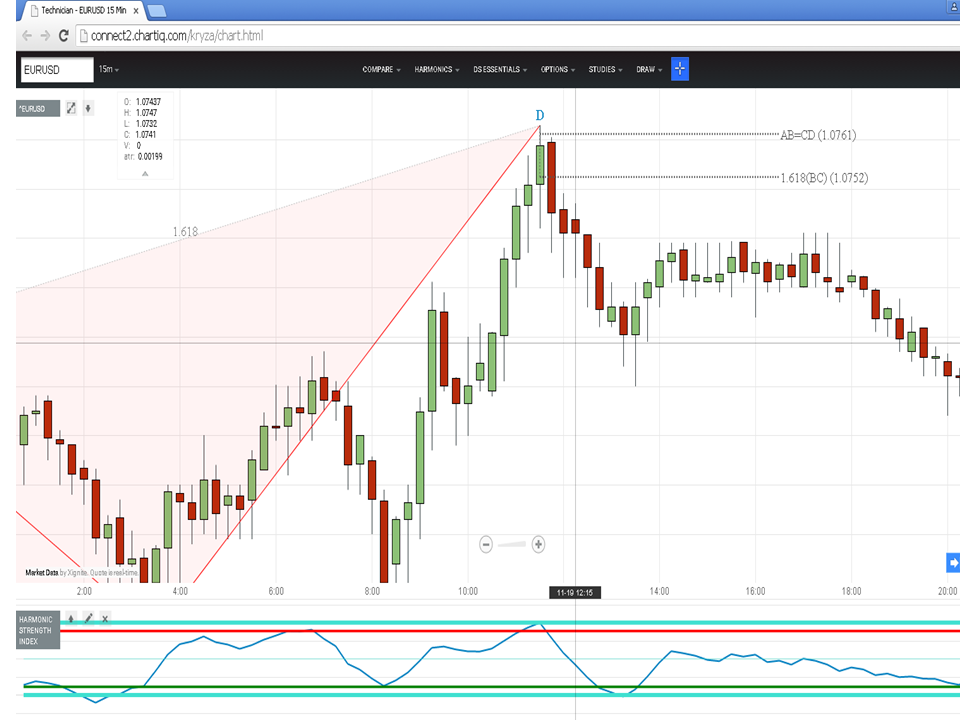
Bearish AB=CD Potential Reversal Zone (PRZ) with HSI
Whether you trade on 5-minute, 60-minute or longer-term daily intervals, the Harmonic Pattern Collection for ChartIQ platform automates these strategies and provides a variety of other technical tools to help traders pinpoint opportunities, optimize profit potential and reduce risk. Personally, I am proud to present such a fine program to help traders navigate markets and better understand price action to realize the financial success that they seek.
Great Harmonic Trading,
Scott Carney
To learn more about the Harmonic Pattern Collection, please access our ChartIQ page: https://technicianapp.com/resources/harmonic-pattern-collection/
Technical Market Analysis - Oil Stocks
video: With oil at multi-year lows, what is the outlook for oil stocks? - Michael Kahn, CMT
Technical Market Analysis - Pre-Fed rebound 12/15/15
video: The market bounced off support and left plenty of reversal patterns. Will they hold after the Fed tomorrow? - Michael Kahn, CMT
Technical Market Analysis - Junk Bonds
video: A quick look at Junk Bonds after the early December sell-off . - Michael Kahn, CMT