The Basics
Stochastics is used to identify market strength, overbought/oversold.
Indicator Type
Momentum oscillator
Markets
All cash and futures, not options
Works Best
Flat markets or trading ranges
Formula
The calculation tells us where price is in its recent range.
Parameters
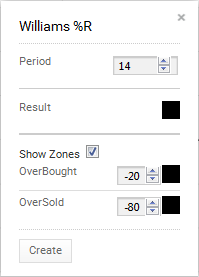
 Most traders and markets use a period of 14 although 9 period and 20 period values are used to make the values more or less sensitive, respectively.
ChartIQ defaults to a period of 14.
The “Show Zones” box allows the user to draw overbought and oversold lines on the plot. They default to -20 for overbought and -80 for oversold but can be changed by the user.
You can also select color for the plot (and the two zones by selecting the boxes next to each to bring up a color palette.
Theory
%R is the measurement of the placement of a current price within a recent trading range. The theory is that as prices rise, daily (or hourly, minute, etc.) closes tend to occur closer to the high end of their recent range. When prices trend higher or are flat and daily closes begin to sag within the range, it signals internal market weakness.
Interpretation
Williams %R creates the same plot as fast stochastics and only the scale is different. However, because it is not smoothed the plot will tend to show many crossovers and therefore could show false signals to the inexperienced user of this technique.
Values above -20 or below -80 are potential market signals. Divergences between %R and the price trend, both within the overbought and oversold ranges, provide evidence of pending reversals in the market.
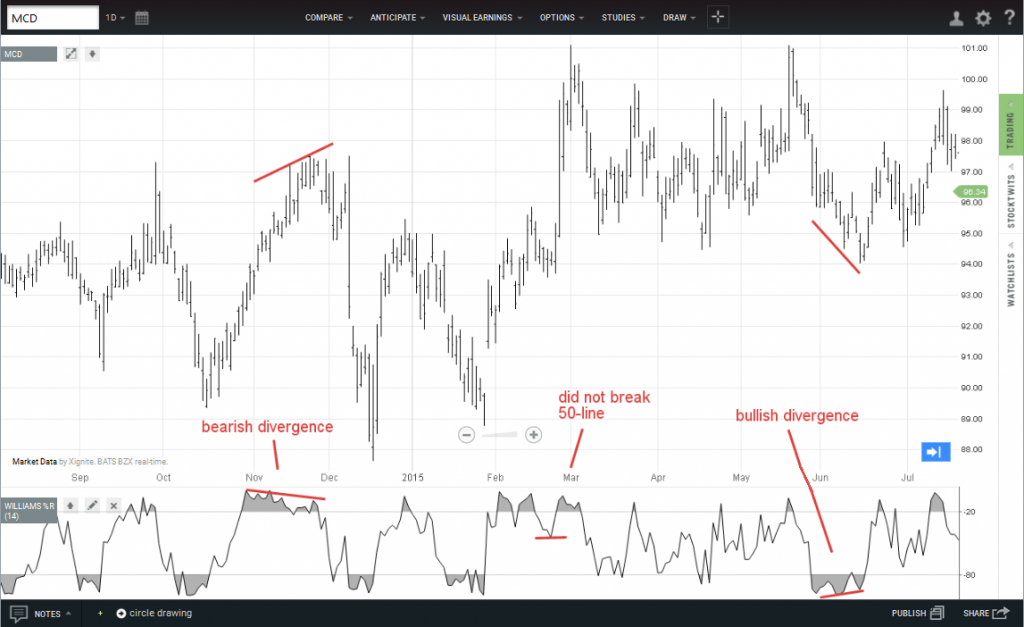
McDonalds rallied in late 2014 but 14-day %R started to fade, forming a bearish divergence. It was a good sign for traders to take profits ahead of the fall.
In February 2015, %R dropped to the -50-level but not below to suggest that the price decline was just a correction and the dip could be bought.
Finally, in June, a bullish divergence appeared as %R made a higher low even as prices fell.
Math
Calculates where price is within a recent range.
- Fast calculation (%K) uses raw value with a simple moving average
- Slow (smoothed) version (%D) uses the simple average with another simple average of the first
%R = (Highest High - Current) / (Highest High - Lowest Low)
The result is multiplied by -100 and is plotted on a scale of -100 to zero
Lowest Low = lowest low for the past N-periods including current
Highest High = highest high for the past N-periods including current

