Intro
Simply stated, support and resistance are respective price levels at which price stops going down or up. A price in any market is one at which buyers and sellers have agreed upon fair value. If more buyers think that price is fair, they will attempt to buy. This, in turn, raises demand and prices rise. As prices rise, buyers become less active and sellers become more active. At some point, buyer and seller activity will balance and this price level becomes resistance.
What Are Supply and Demand in the Markets?
In any capitalist marketplace, supply and demand rule. Let’s say a government study on the benefits of a certain wonder product reports that it is 100% safe and effective. High profile celebrities endorse the product and there are no competitive products anywhere. Does this mean the maker of this product will see its profits rise?
The answer is maybe. Profits will rise if, and only if, sales are made. If there is no demand for the product at the price at which it is offered, there will be no sales. The same reasoning holds true in the financial and commodity markets. If the price of a stock or commodity is too high, there will be no demand and no buyers. If the price is too low, there will be too much demand relative to supply and hence too many buyers.
In the example above, the maker of the wonder product may have a great product that will make lots of profits but a company is not its stock. Demand for the stock is not demand for the product that it makes. Only an imbalance in buyers over sellers makes the price rise.
Perceptions Are Reality
When a market trades between support and resistance, buyers and sellers are adjusting their actions according to what each perceives as being fair market value. At support, demand has increased to a point where it balances out supply. Conversely, at resistance, demand has decreased (supply has increased) to a point where it again balances. These balance points are different at each price level.
As with rumors and advertising, the more times we hear something, the more we accept it. In the markets, the more times a market touches a support or resistance level, the more important that level will be perceived. Buyers and sellers become accustomed to acting in a certain way at each level. Unless something happens (usually news) that causes perceived value to change, support and resistance levels will contain the market.
Let’s use an example in the stock market. Resistance for the stock of XYZ Company is at 50. The market bounces around below 50 for several weeks until it finally pushes above that price. Whether these new buyers acted on earnings news, an inflation report or a signal from a trading system does not matter. The charts show a breakout above resistance indicating a new level of higher demand and lower level of supply.
An interesting thing now happens. If the market trades back down to 50, buyers who missed the earlier breakout will see their second chance to get in. The market bounces up off the 50 level, which has now become support. Why is it now support? The reason is that the general level of valuation perception in the market has changed. What was once considered too high is now considered too low based on the new levels of supply and demand.
Let’s say supply and demand balance out again at 55. Every time the market moves up to 55, sellers who missed their chance to unload their stock at that price earlier will become active. They fear that they will never see that price after the next pullback. Again, at 50, the greedy see that they can pickup some more cheap stock before it goes up again.
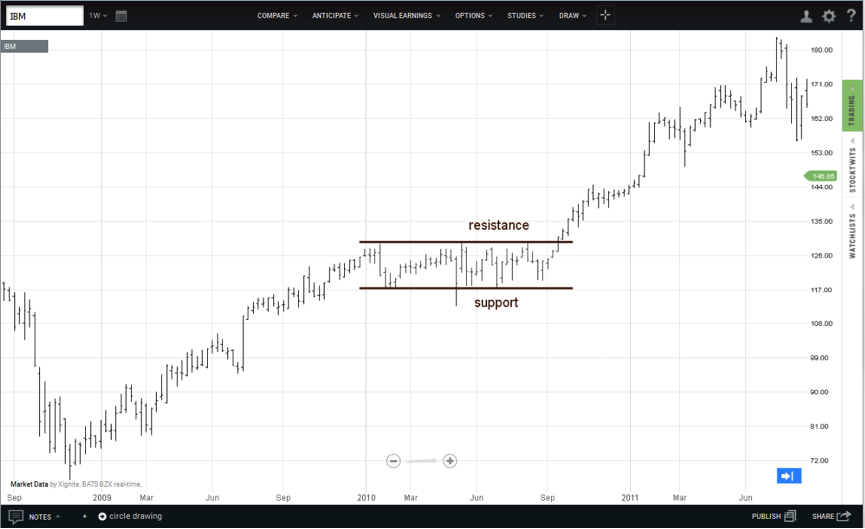
The weekly chart of International Business Machines in 2010 illustrates this point. The highlighted area shows how the stock traded between support at 121.40 and resistance at 133.40. Something happened in September that changed people’s perceptions and what was once expensive (resistance) was not thought to be cheap. The stock broke out to the upside.
Support and resistance levels often become relevant again in the future. If a stock is halted at the 50-level enough times, both buyers and sellers become used to acting a certain way at that price. And while an individual may not recall what he did in the past, the market – the collective wisdom of everybody – sure does.
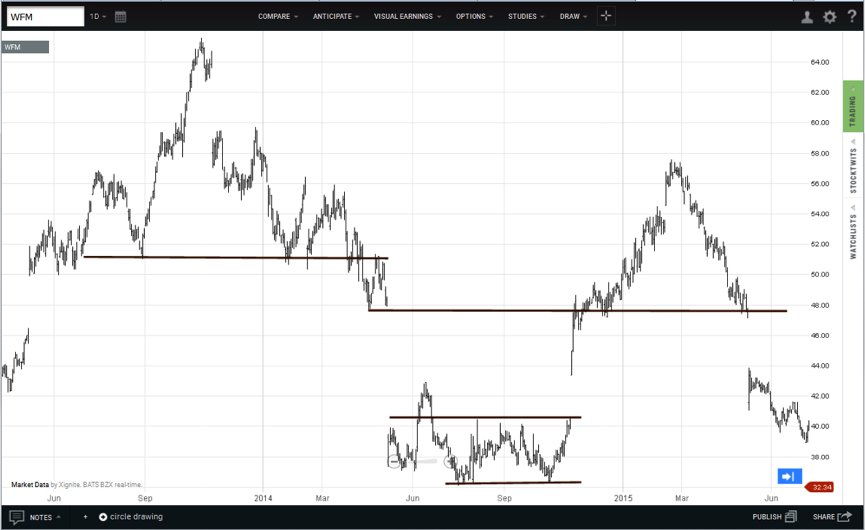
Whole Foods Market had a very rough couple of years between 2013 and 2015. On its way higher in mid-2013, it established a support level at 51 as see on the chart. After peaking and heading back down it found support once again at 51 and not on just one occasion. This level’s importance grew tremendously. When support broke in April 2014, the stock hesitated and ran up to touch 51 one more time. Late sellers got their chance to sell and supply swelled.
A smaller support level was established in April and May at 47.85. After the stock’s collapse and recovery, where did it stall? In November 2014 it ran into resistance at 47.85.
After the rally resumed, peaked and then started heading lower, where did the stock find temporary support in April 2015? Once again at 47.85. It broke that level and collapsed once more time.
Summary
The unasked question is “why doesn’t the market jump immediately from one equilibrium level to the next?’ The answer is that information flow is not perfect and people to not all reach the same conclusions at the same time. As the masses slowly jump on board a trend or breakout, the momentum builds until price reaches levels that exhaust excess supply or excess demand. These are then called support and resistance.
Disclaimer
It should not be assumed that past performance is any guarantee of future results. Results obtained from any information provided in this article are not guaranteed to be profitable. It should be understood that investing or speculating in the financial markets involves risk and may result in either a partial or total loss of one’s investment capital. The information presented in this article is believed to be reliable, but cannot be guaranteed as to its accuracy or completeness.
ChartIQ Inc. and/or its principals and employees will accept no liability whatsoever for any loss arising from any use of the information contained in this article. ChartIQ Inc. does not offer trading advice of any kind and we are solely involved in the business of financial software development.
Reproduction, duplication, or redistribution of the indicators or any material in the Resource Center, in any form, without prior written permission from ChartIQ, Inc. is strictly prohibited.
Other brand and product names used in this article may be registered trademarks of their respective owners. Their use is for identification purposes only.


