The Basics
MACD stands for Moving Average Convergence-Divergence. It is used to identify overbought and oversold conditions.
Indicator Type
Momentum oscillator
Markets
All cash and futures, not options
Works Best
Wide-swinging trading ranges and at the conclusion of strong trends.
Formula
The Moving Average Convergence-Divergence (MACD) indicator makes use of three moving averages, usually of the exponential variety. Two are averages of price and the third is an average of the difference of the other two.
The MACD line is generated from the first two averages, subtracting the longer from the shorter. The Signal Line is simply a moving average of the MACD line.
Parameters
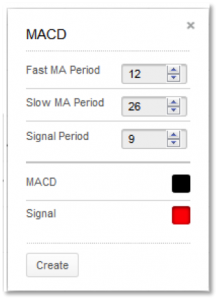
 Common moving average sets are {12,26, 9} for bottoms and {19, 39, 9} for tops. As with all moving average based analyses, the longer the averages, the longer the analysis horizon.
Technician defaults to the {12, 26, 9} set.
You can also select colors for the MACD and Signal Lines by selecting the appropriate box to bring up a color palette.
Theory
In an upward and smoothly trending market, a longer average will be increasing. A short average, being more sensitive to normal price fluctuations within the trend, will show more changes in direction. If the two averages are plotted together, the shorter average will oscillate around the longer average. A strong near-term rally will cause the difference between the two moving averages to increase until an extreme value is reached. This signals an overbought condition. Conversely, in a down market, spreads will become negative until an extreme is reached indicating an oversold condition.
Interpretation
As a rule, the market is bullish if the MACD line is rising and is above the Signal Line. It is bearish if the MACD line is falling and is below the Signal Line. Buy signals are given when the MACD crosses above the signal; similar to price crossing above a moving average. Sell signals are given when the MACD crosses below the signal.
Other analysis includes divergence with price action. While extreme values of the MACD line reveal overbought and oversold conditions, since MACD is not indexed (constrained to move between 0 and 100), extreme values must be relative to its own history.
Finally, crossovers of the zero line are also useful in determining trend direction.
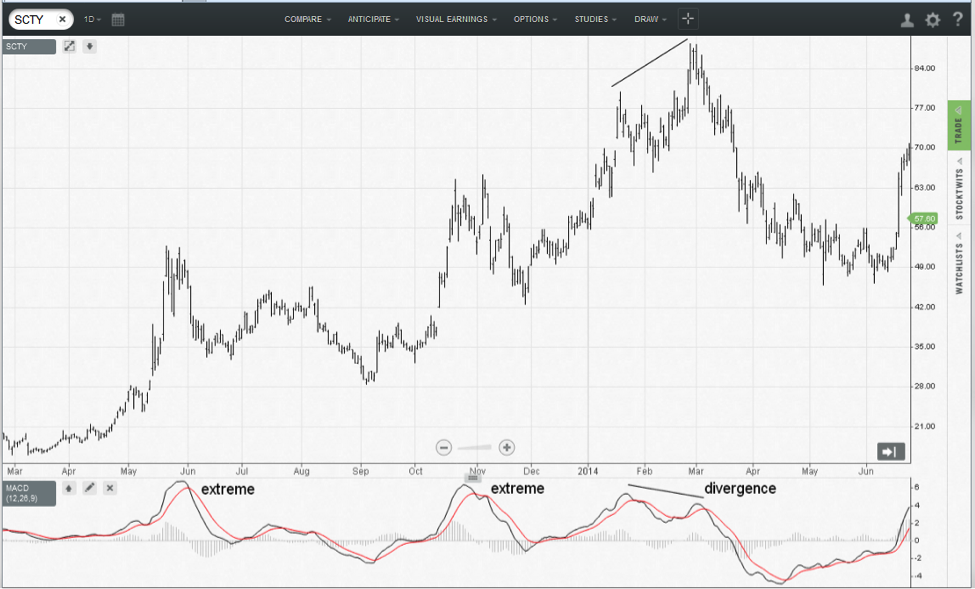
The chart shows Solar City between 2013 and 2014. We can see extreme levels of MACD in May 2013 and October 2013 before prices peaked. We can also see a bearish divergence between MACD and price action in March 2014. Note that the MACD line crossed below the Signal line during the congestion zone seen that month. It preceded the price breakdown by several days`
There is also an extreme reading to the oversold side in April 2014. It was clearly much lower than previous MACD troughs seen in the chart although the trend in 2013 was rising. We can classify the resulting gains in MACD as a bullish divergence although it was not a text book case. If anything it gives us an idea that the stock was starting to heal rather than pause before another sell-off.
Math
MACD line – short moving average minus short moving average
Signal line – a moving average of the MACD line
Histogram - same as MACD line but in a different visual format
Averages are usually based on the close and are exponentially smoothed.

