Build
Portfolio Builder
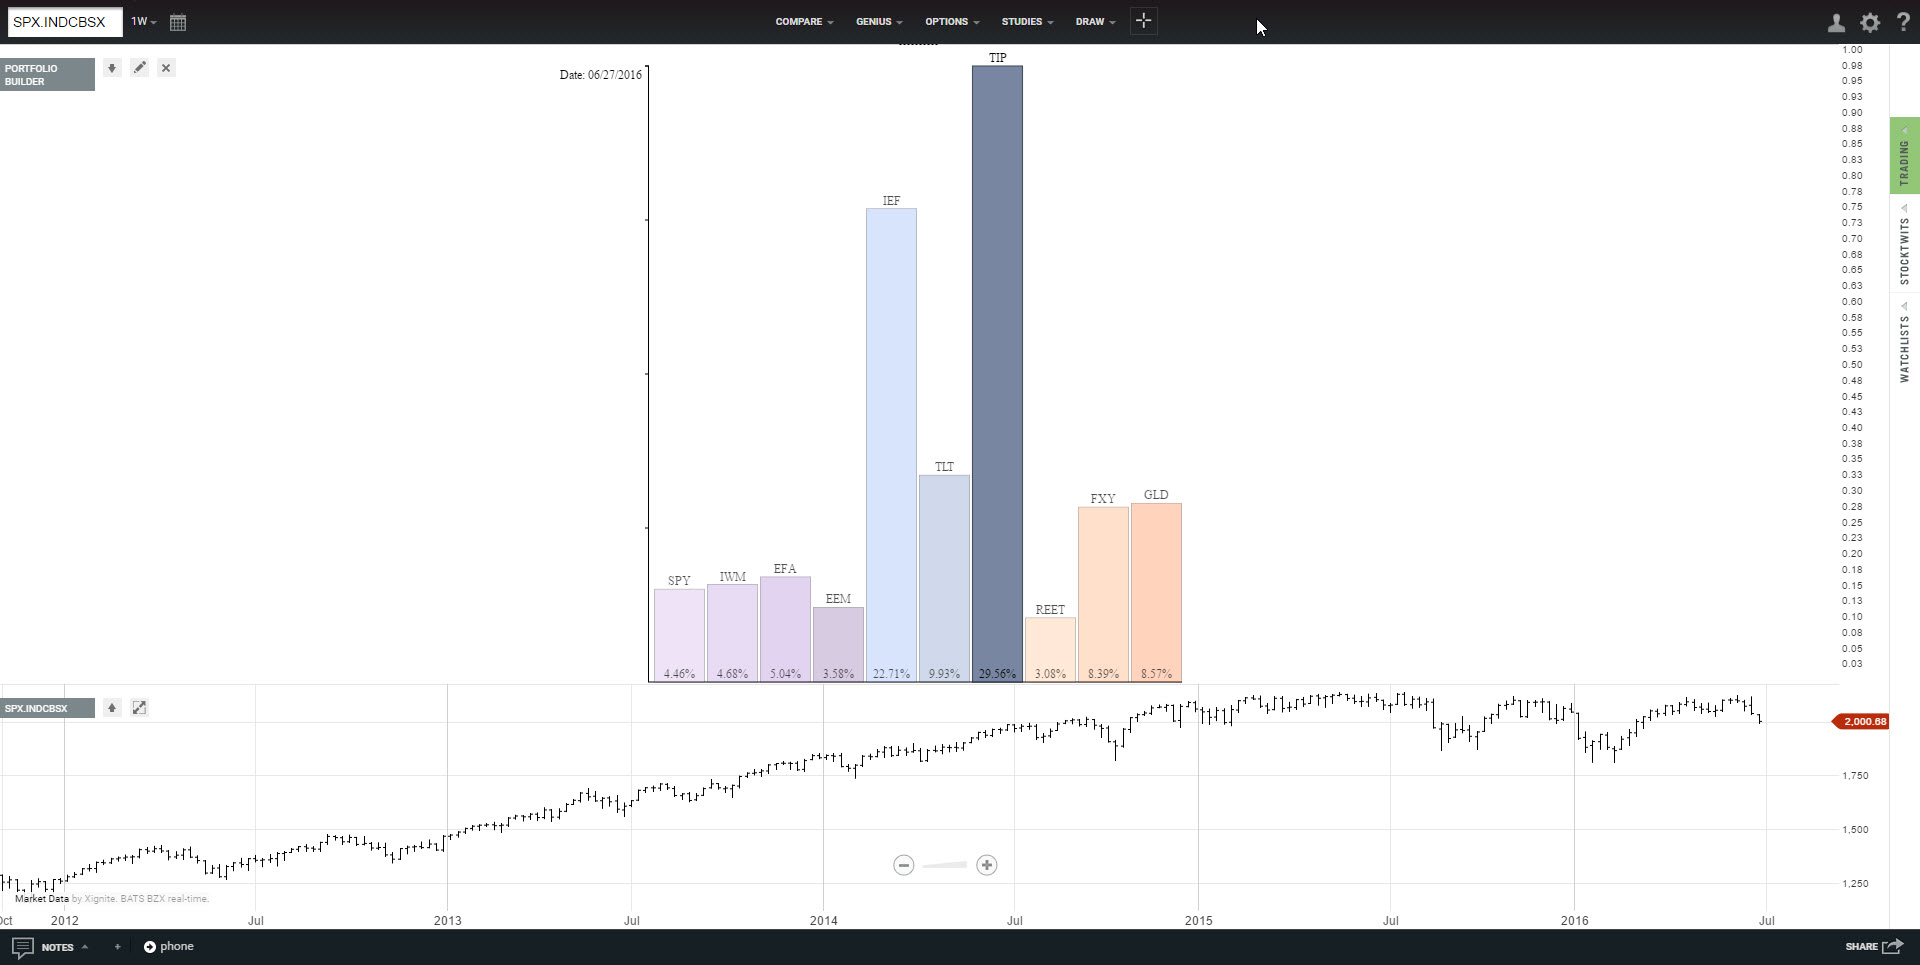
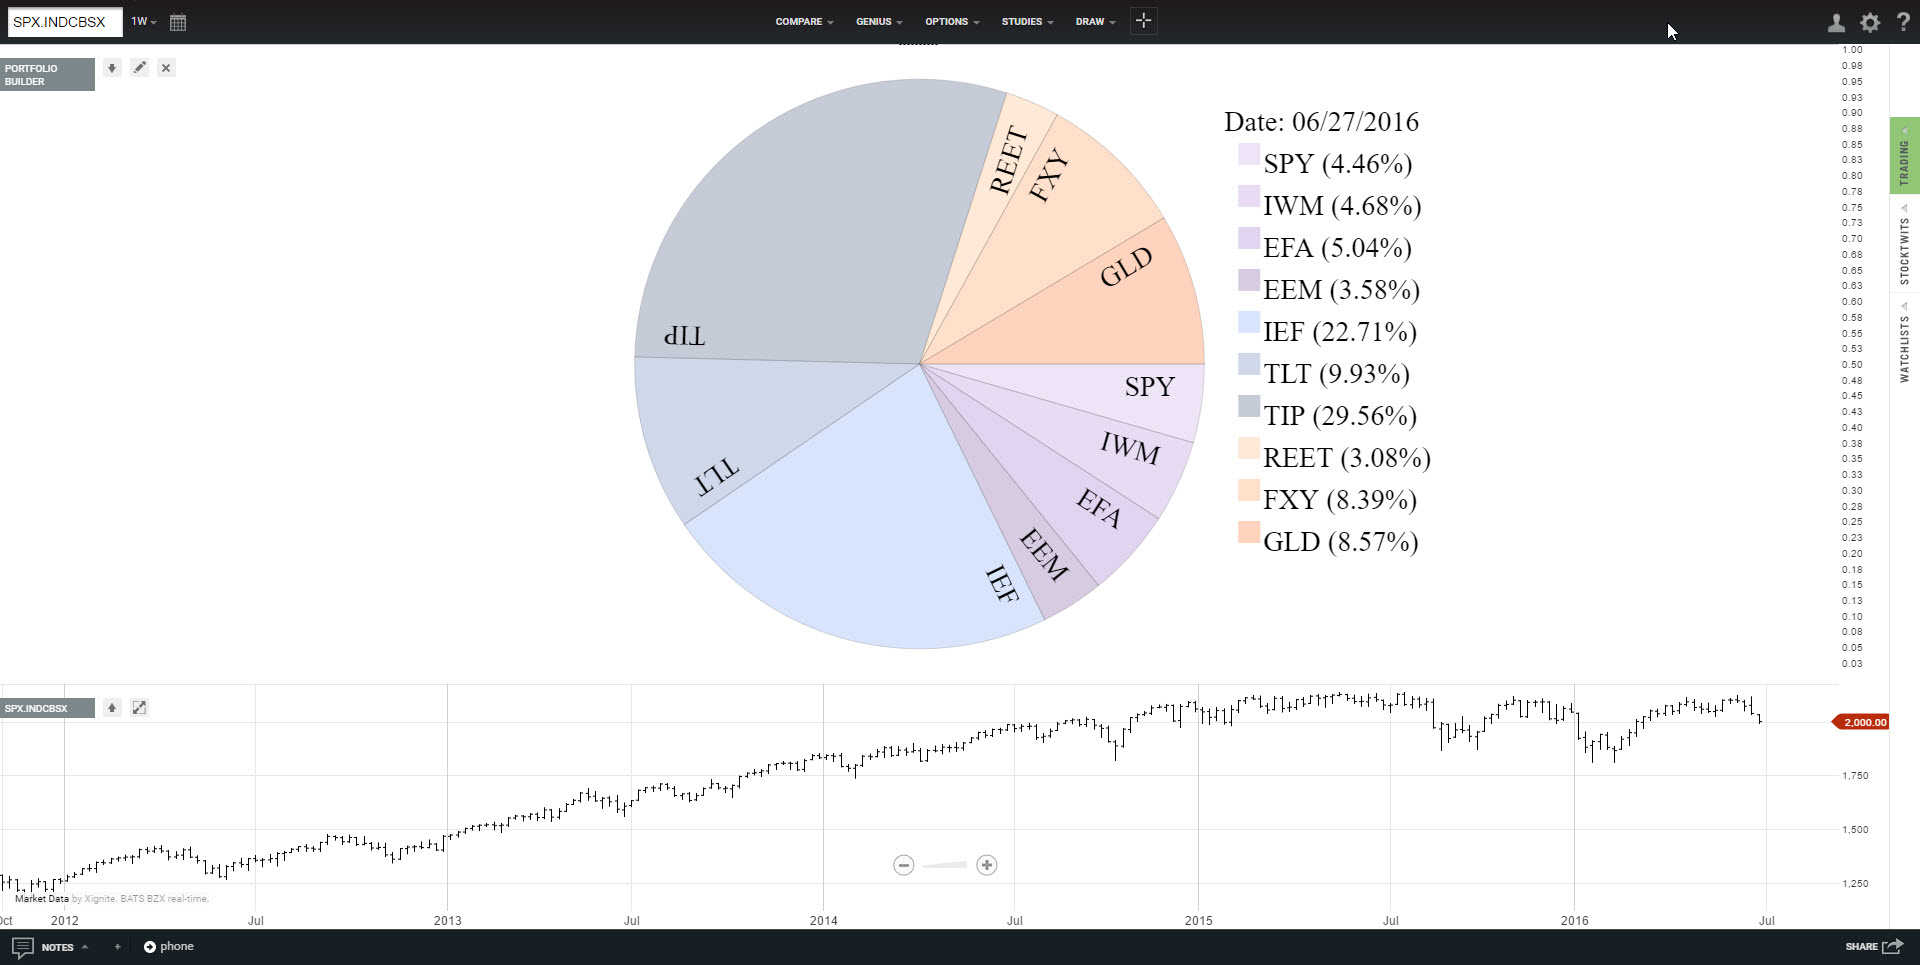
Create your own custom investment portfolios. Portfolio Builder automatically calculates the optimal amount to allocate to your preferred combination of stocks, mutual funds, exchange traded funds (ETFs) or currencies found in the Technician symbol universe. Allocations are generated based on your selection of daily, weekly or monthly price data.
Monitor
Stress Test (R)
Periodic Returns
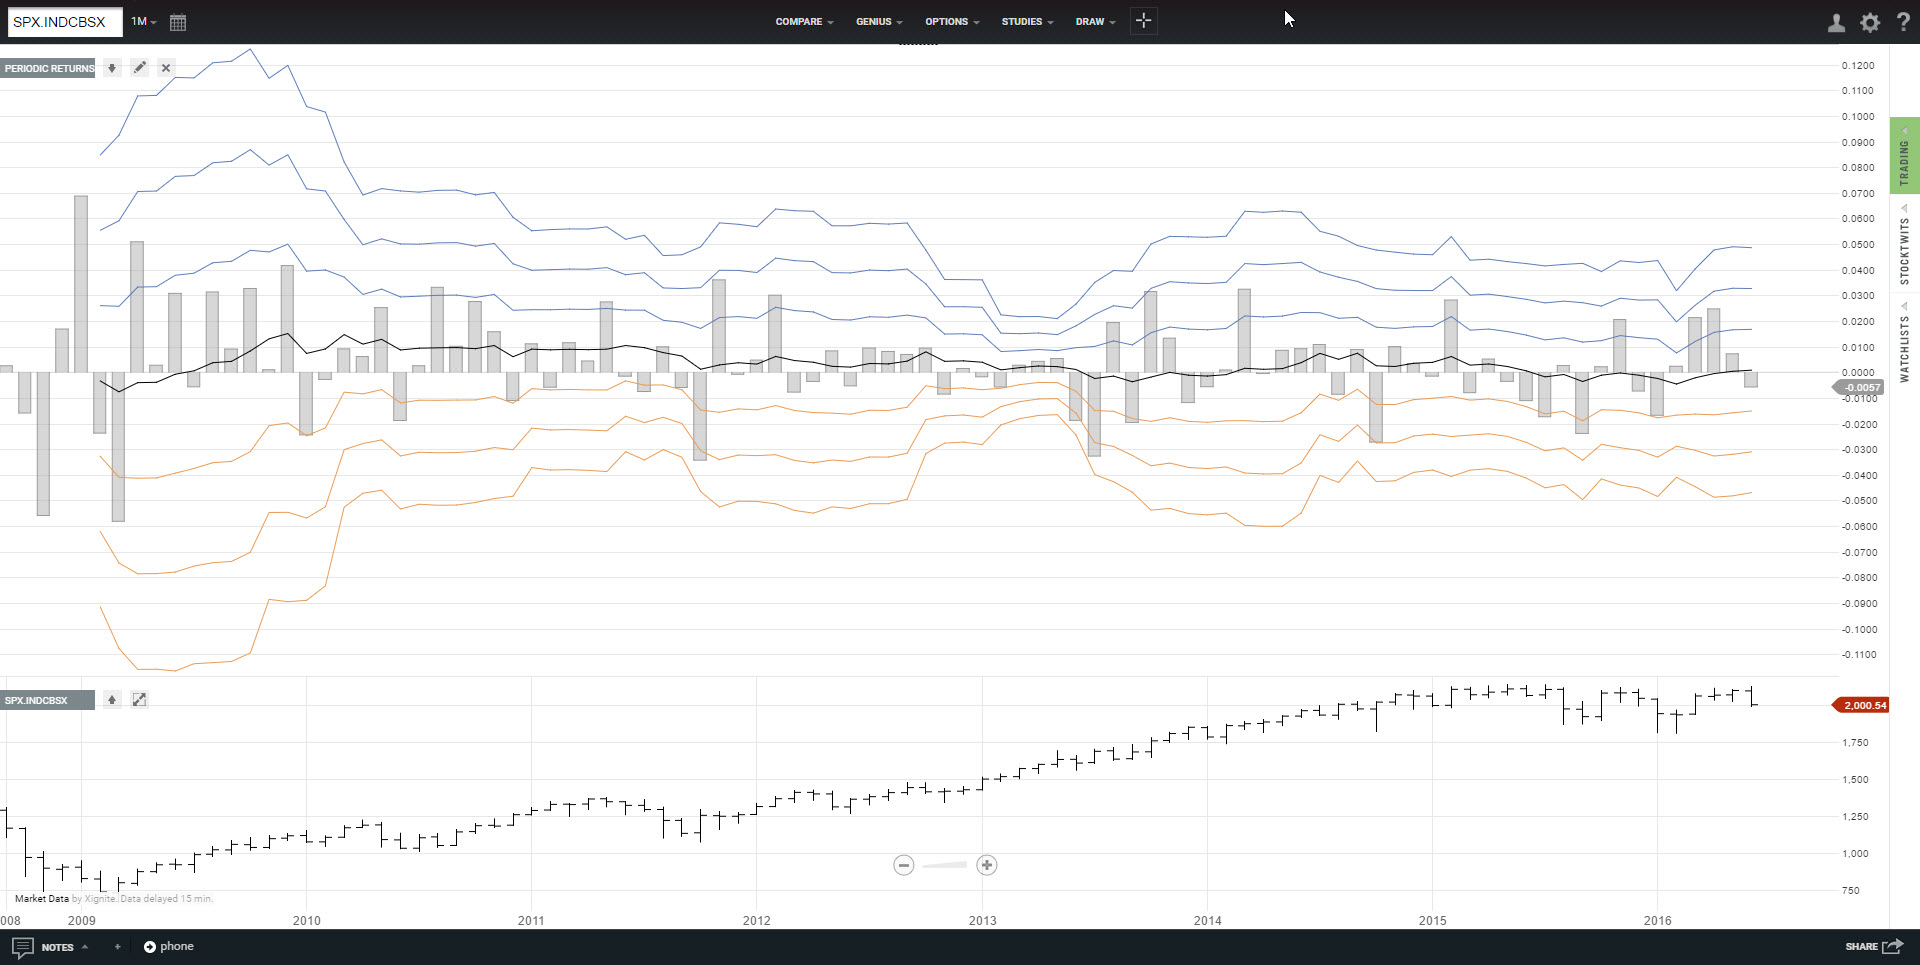
What upside and downside performance can you expect from your investments? Stress Test (R) makes it possible to visualize and review the periodic (day-to-day, week-to-week, month-to-month) return of your custom investment portfolio over time. While past performance is not indicative of future performance, poor historical performance is a bad sign of things to come.
Stress Test (G)
Advisor Check (R)
Periodic Returns
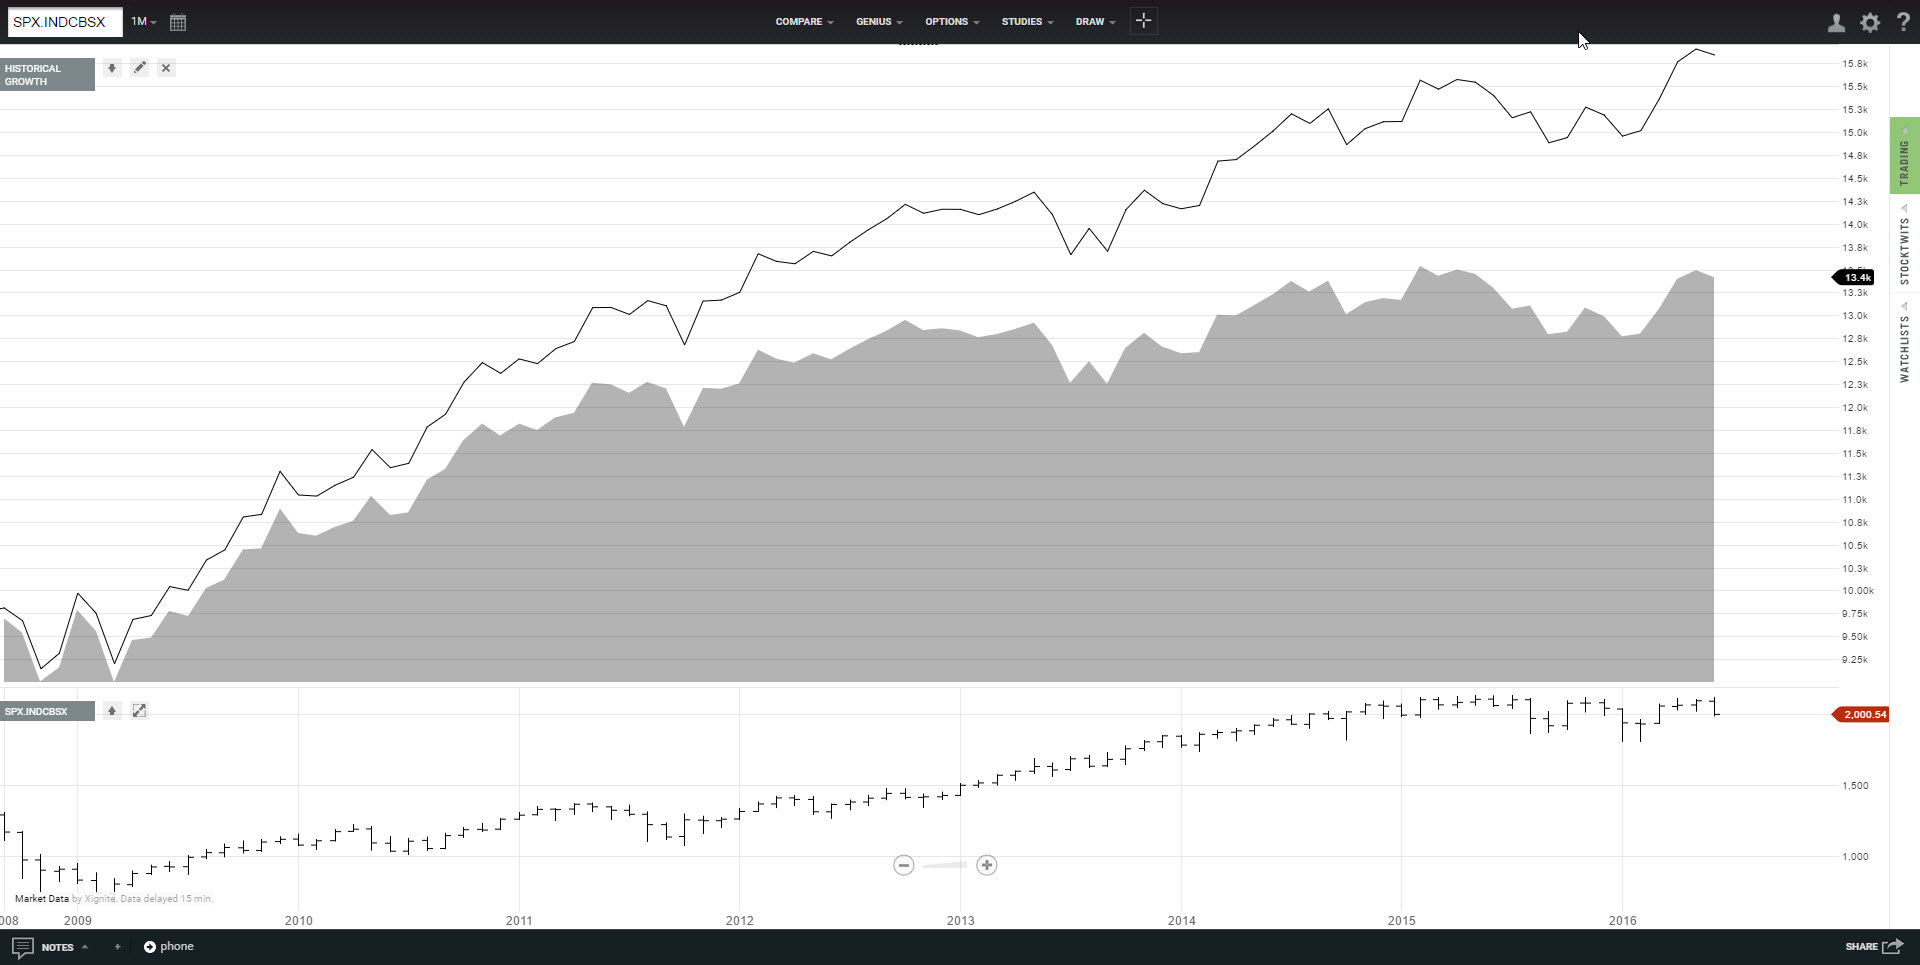
Have you ever wondered how the investment portfolio recommended by your advisor performed in the past? Now you can use Advisor Check (R) to visualize and review the periodic (day-to-day, week-to-week, month-to-month) return. Simply enter the ticker symbols and the percent allocated to each and see for yourself.
Advisor Check (G)
Trade
Buy/Sell Signals
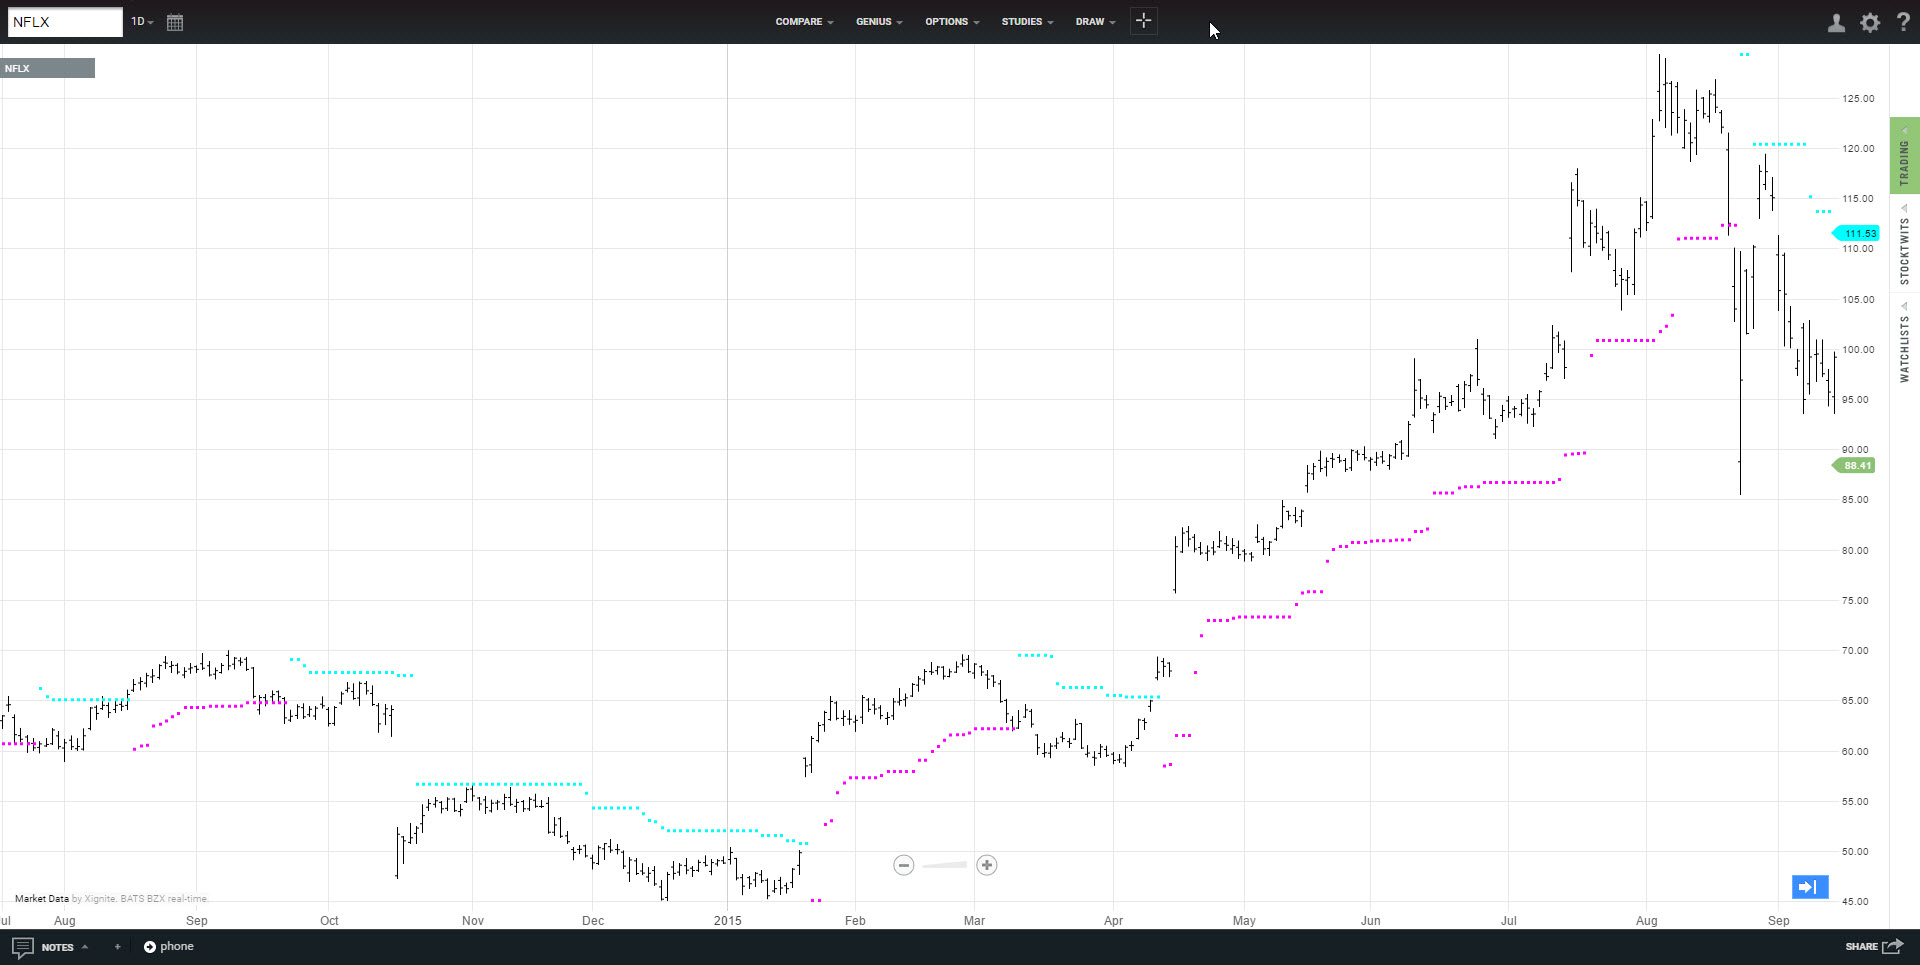
Automatically generate buy and sell signals for any available ticker symbol based on intraday, daily, weekly or monthly price data. Optional filters for Channel (avoid contratrend trades), Trend (moving average), and Volatility (quartiles) are provided to further qualify trades.
BUY RULE: When the trading system is on a sell signal, blue dots will appear above the pink price bars to indicate the stop loss/reversal point; if price *closes* above the dot, a buy signal will be issued. LE indicates long entry. LX indicates long exit.
SELL RULE: When the trading system is on a buy signal, pink dots will appear below the blue price bars to indicate the stop loss/reversal point; if price *closes* below the dot, a sell signal will be issued. SE indicates short entry. SX indicates short exit.
Stops (Auto)
Stops (Manual)
Sizer (MV)
NOTE: Due to its processing power requirements, Sizer (MV) is not available on mobile devices.
VolatilityQ
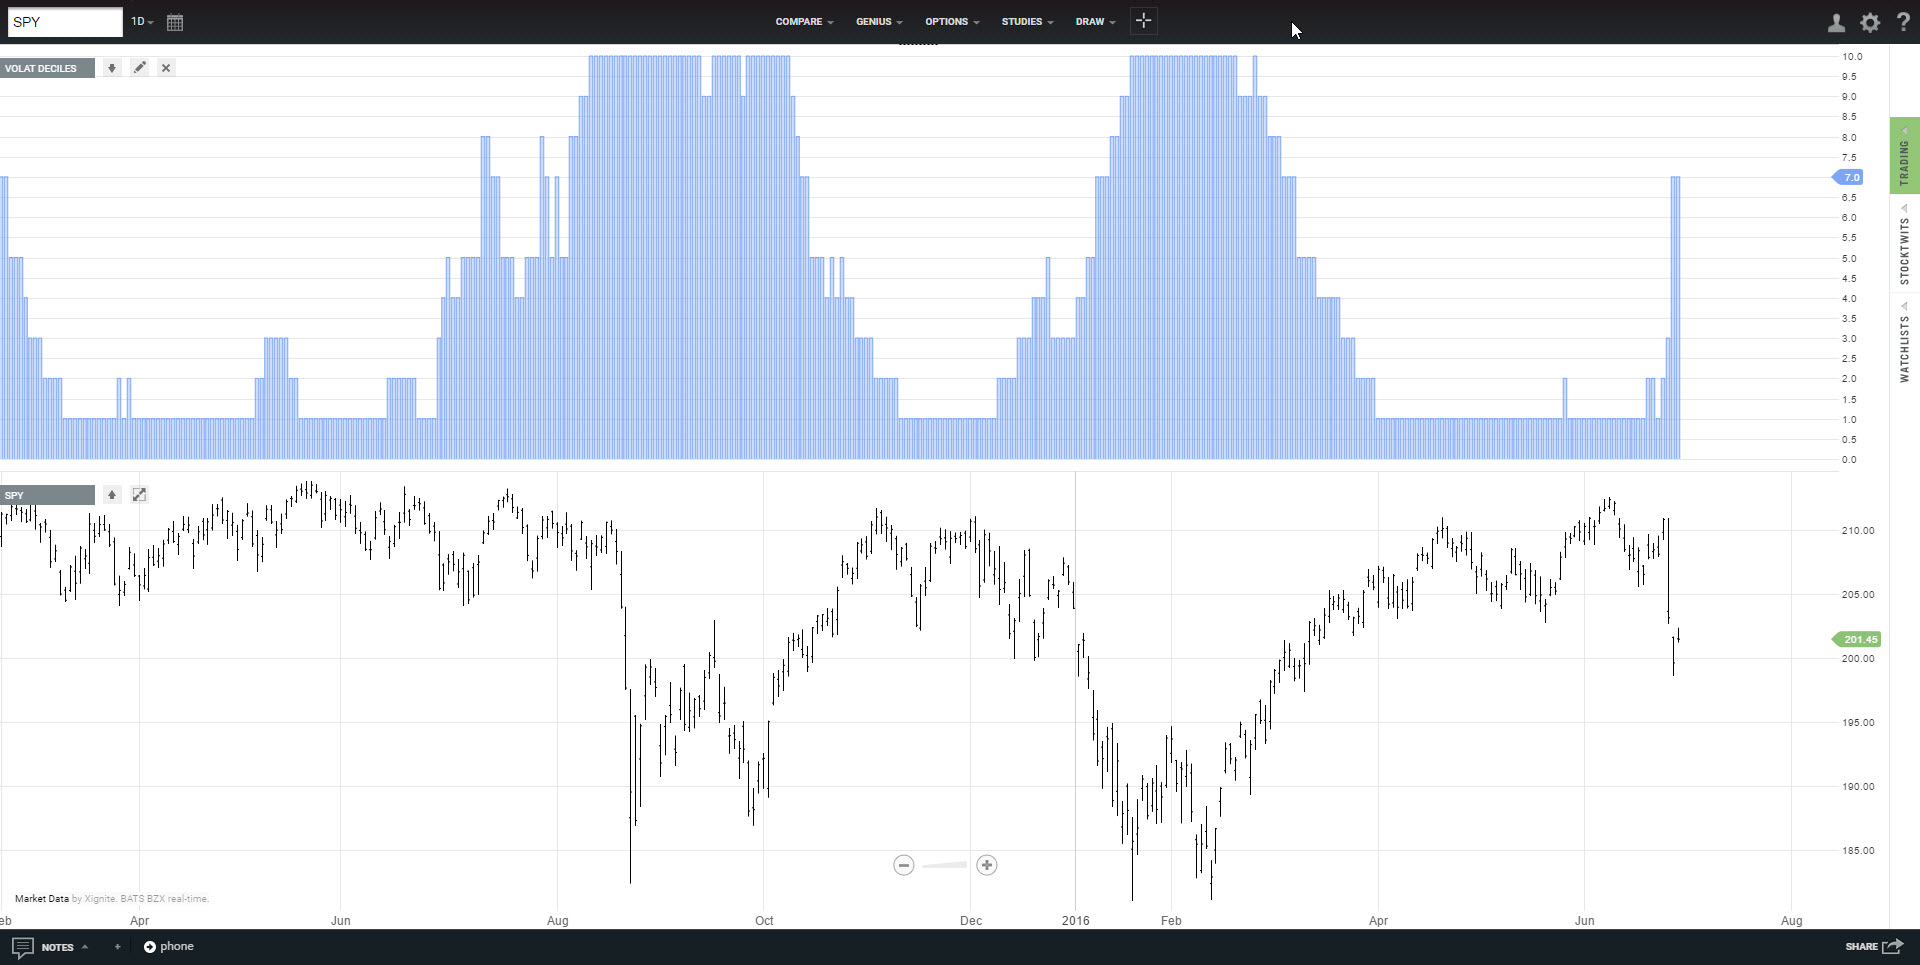
Volat Quartiles
We monitor price volatility for one simple reason: it tells us how much risk we should take in terms of exposure. In our own portfolio management practice, these readings are used to adjust cash or leverage levels. We generally match the rebalance frequency with the time horizon calculated. For example, a portfolio that is adjusted once per month is done using the monthly volatility reading.
VolatilityD
Hedge Ratio
Hedge Ratio (Hull)
There are circumstances such as tax considerations and potential binary market events when hedging an investment can be more desirable than selling it or cheaper than protections with options. This hedge ratio is adapted from the definitive book on options, futures and other derivatives by John C. Hull.
Risk Profile
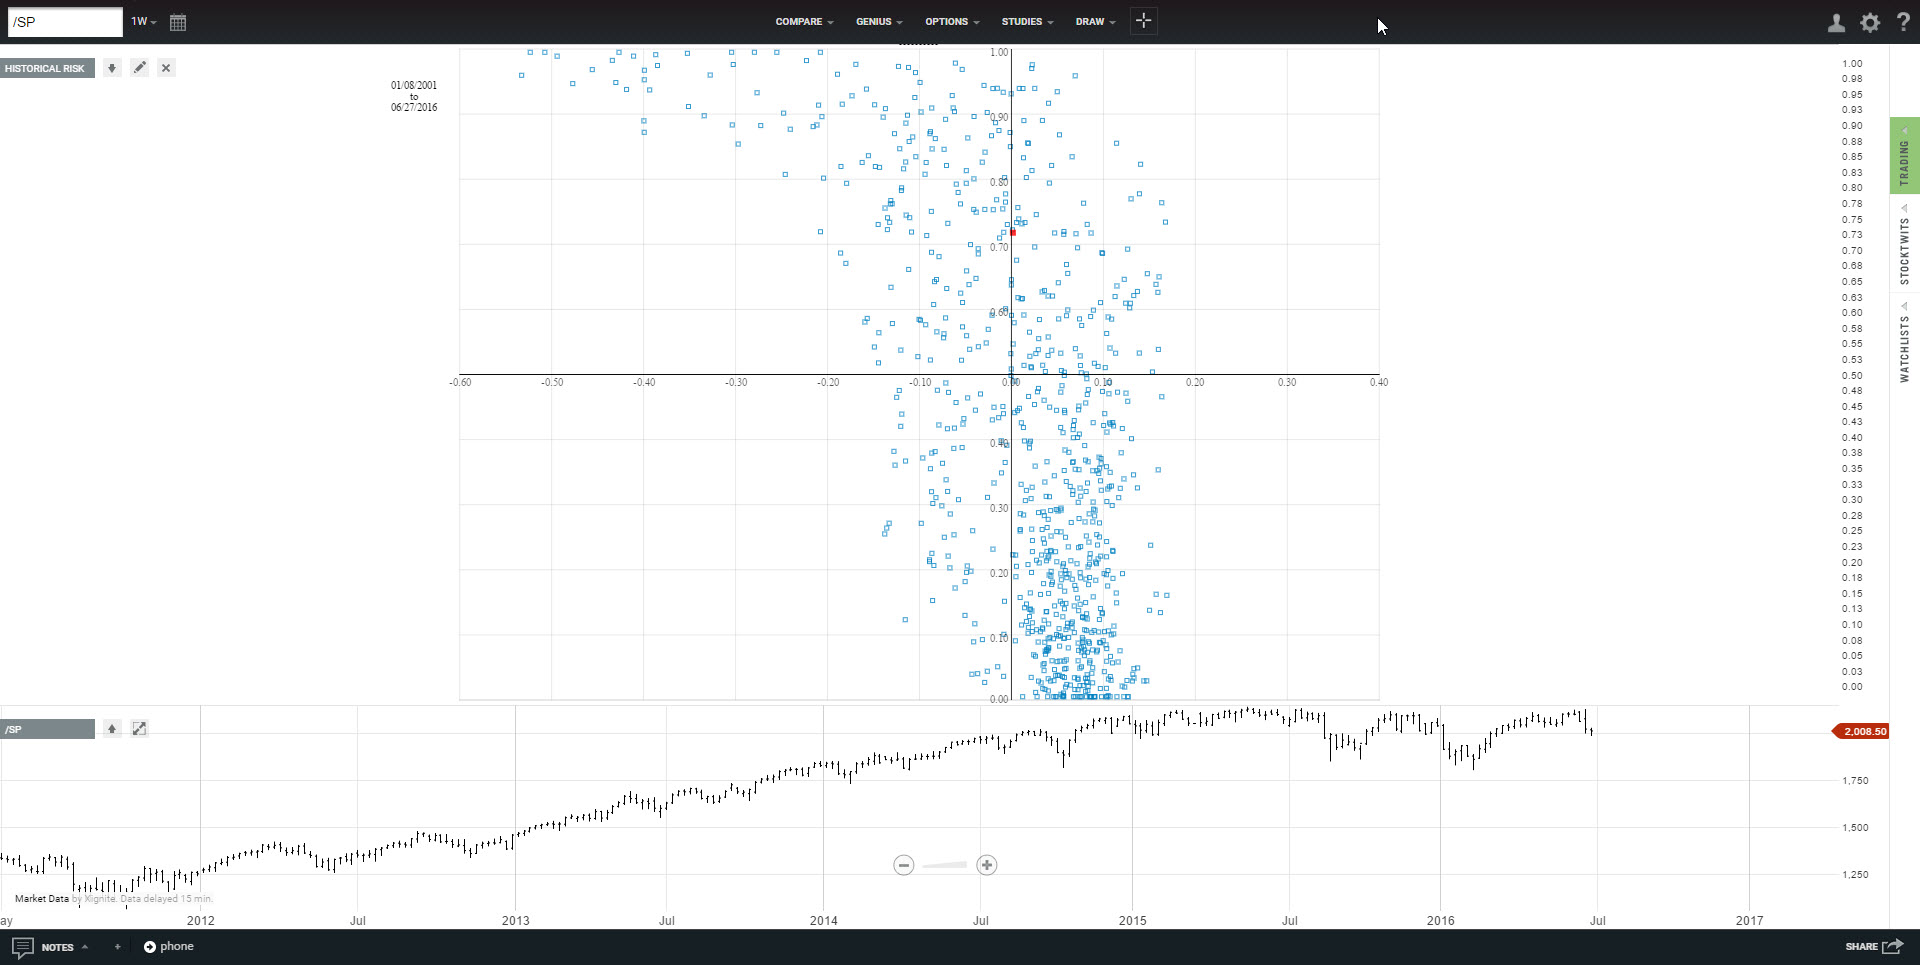
Historical Risk
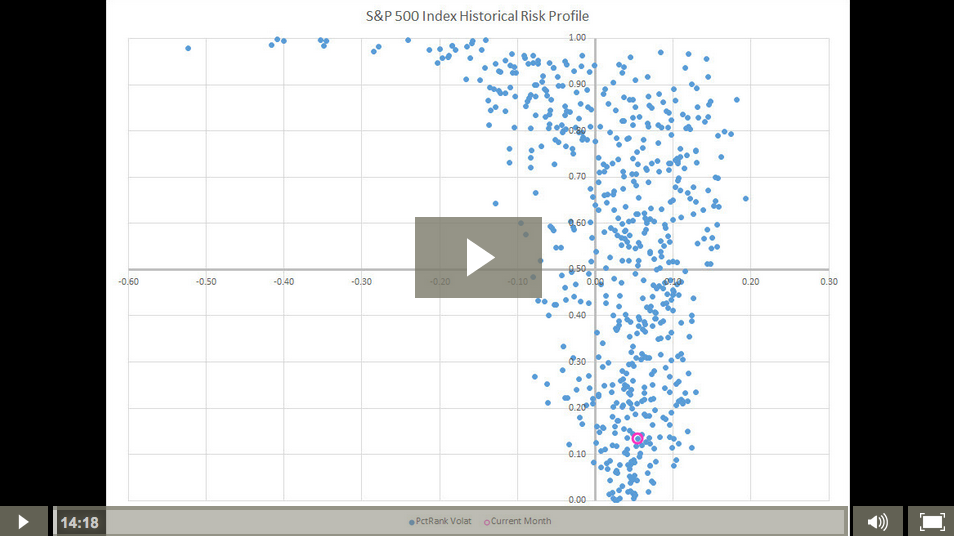
Historial Risk Profile is a unique visual display of “were we are now.” We identify four market conditions based on price return and volatility so that you can trade or invest accordingly. For example, when the S&P 500 Index is consistently in the lower right quadrant, price is probably going up smoothly. Just be long and watch it beat all the active managers.
Here’s a short video demonstrating the concept.
Correlation
NOTE: Due to its processing power requirements, the Correlation heat map is not available on mobile devices.
Dispersion
Diversified or Not
According to Craig Lazzara, low dispersion is “a major contributor to the failure of most active managers to outperform their index benchmarks.” Translated, it means there is one more way to know when stock picking will be rewarded, or not. Even though it’s not feasible to crunch the numbers for all 500 stocks in the S&P 500 on your smartphone, we can approximate it in real time with Select Sector SPDRs or calculate it for your core holdings. Especially useful to stock pickers.
PDFs
http://us.spindices.com/documents/research/research-dispersion-measuring-market-opportunity.pdf
http://www.spindices.com/documents/research/research-some-implications-of-sector-dispersion.pdf
Risk AP
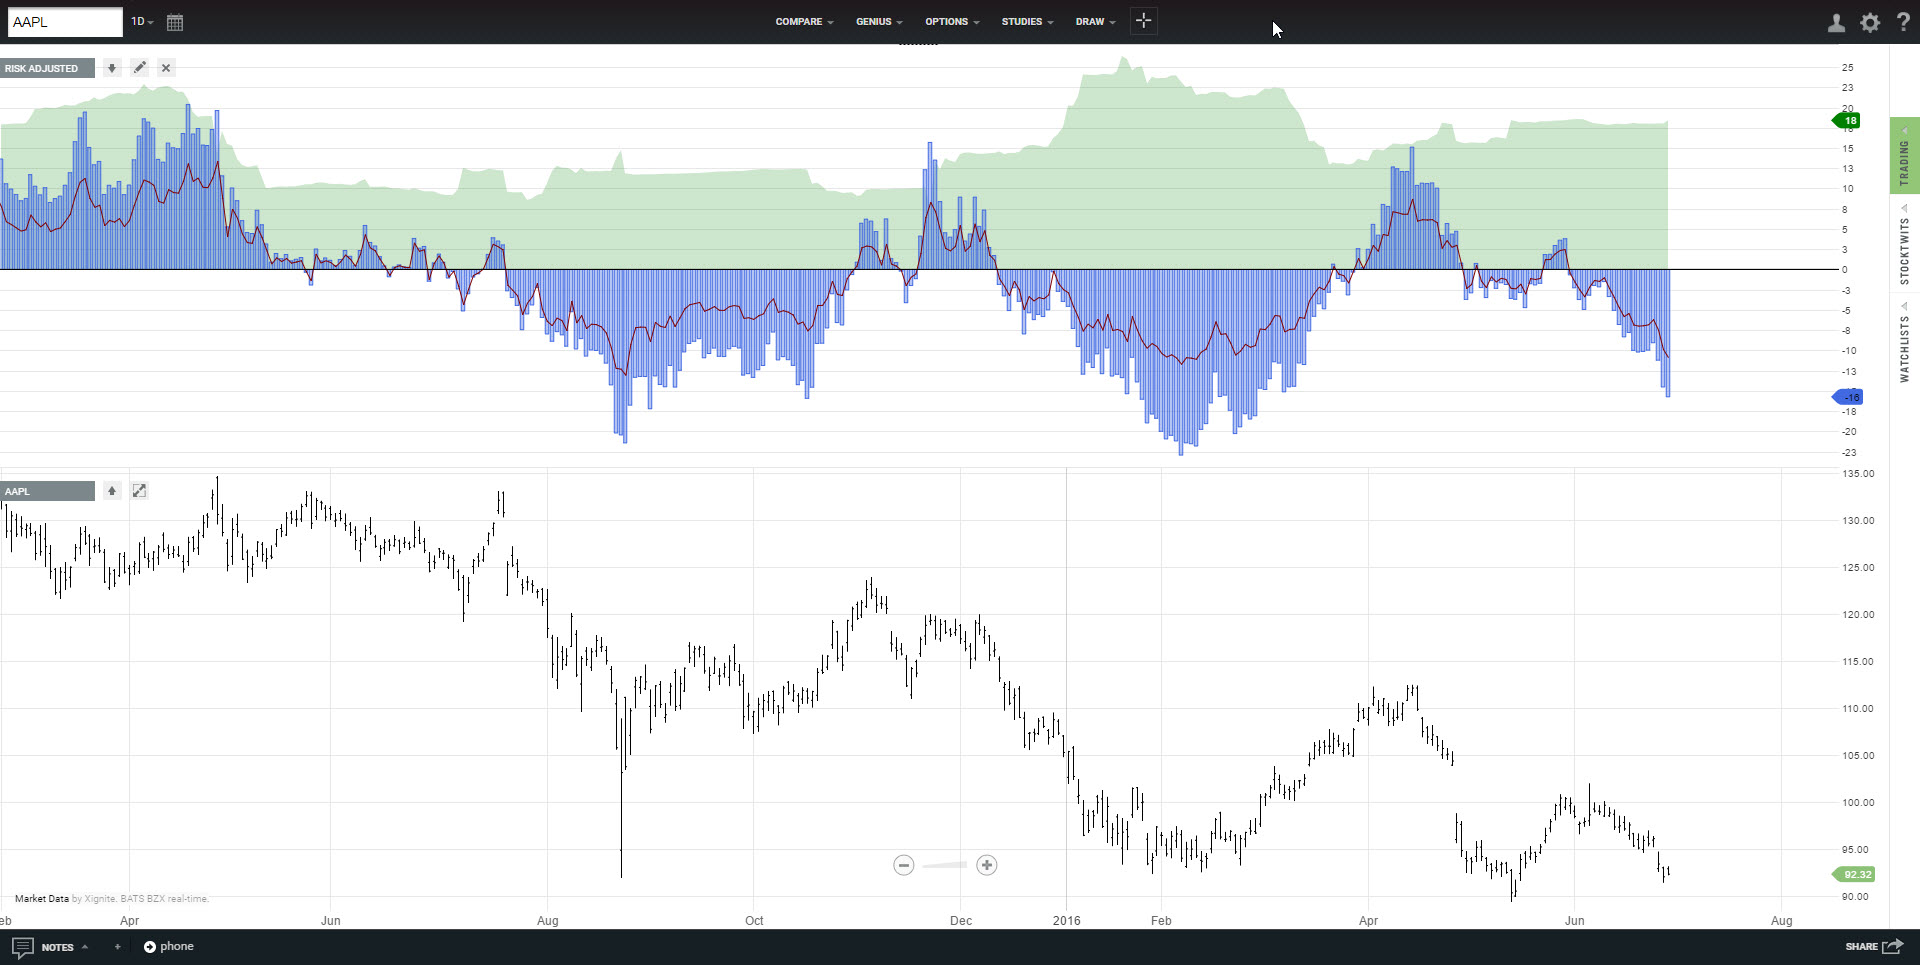
Risk Adjusted Performance
Many traders attempt to beat the S&P 500 index by chasing stocks that are outperforming the index, but they forget that high returns now will probably mean large losses later. By evaluating performance that includes risk, we not only level the playing field, we make it possible to compare anything side by side.
It is important to consider the other side of the coin: risk. Thats why we rank stocks based on the concept of mileage. Instead of miles per gallon, our metric is reward per unit risk. Return per unit risk is not a new concept. The Sharpe Ratio is one measure. Modigliani M-squared is even better. Both incorporate the price return and the volatility of price return into their calculations.
Benchmark AP
Benchmark Adjusted Performance
Sam Stovall popularized sector investment and analysis in the mid-1990s. While investors can apply various fundamental and technical research techniques, the most objective way to evaluate price performance of individual sectors is to compare them relative to each other.
Our rebase technique make it possible to compare the net performance of these ticker symbols of different price levels against a benchmark. The chart displays the percent change in price of a number of ticker symbols over a number of days/weeks/months, less the percent in change of a benchmark ticker symbol.
For example, tracking the performance of the Select Sector SPDRs against the benchmark S&P 500 Index provides us with information that can be used to identify and perhaps anticipate future rotation of these sectors within the S&P 500 Index.
VWAP
Volume Weighted Average Price
What is a popular technical indicator is now also an order type at some brokerage firms, calculated “by adding the dollars traded for every transaction in that stock (“price” x “number of shares traded”) and dividing the total shares traded.”
TrendVue
Extremes
Spike Detector
We know that volatility comes in clusters. The objective is to identify clusters of volatility as a market condition, rather than to use any single point as a trade signal.
In our practice, we monitor broad stock indices on the daily and weekly time horizon. When we identify a group of disbursed dots/volatility cluster, we know there is the potential of something big.
Not all tremors end with devastating earthquakes, but when the ground starts to shake, it is a good idea to be prepared. Not every cluster ends in a crash, but every crash begins with a cluster.
Swings
Swing Lines
This is a simple, yet highly effective visual tool that allows traders to instantly gather critical information from a price chart. Swings are used to identify of support and resistance points that form classic technical patterns. Bar-based swings can be used on any time frame for any ticker symbols.
Our swing lines are connected based on the natural action of price bars relative to each other. There is no need for user input.
Identify pivots, major support and resistance points where price reverses to form swing highs and swing lows
- Identify trends based on the relationship between successive upswings, downswings and the location of the swing highs and swing lows
- Identify and differentially diagnose congestion patterns in order to avoid choppy markets
- Identify and differentially diagnose retracement patterns and tests based on the relative positions of the swing pivots in order to enter and exit in a timely fashion

