The Basics
The Commodity Channel Index (CCI) is used to time buys and sells based on overbought and oversold conditions.
Indicator Type
Momentum indicator
Markets
All cash and futures, not options
Works Best
Developed for commodities, it works in all markets that have cyclical patterns and are currently trending.
Formula
The CCI starts with the average of the high, low and close for the period and subtracts the “n” period moving average. The goal is to measure the current price level relative to an average price level over a given period of time, normalized for the average price over time.
Parameters
 The typical period used is 20 although some traders use a number of periods less than one-third of the cycle length. Larger numbers of periods are less prone to whipsaws.
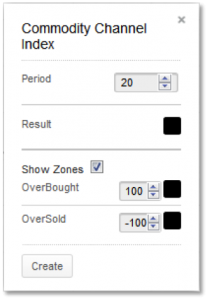
Technician defaults 20-periods.
The “Show Zones” box allows the user to draw overbought and oversold lines on the plot. They default to +100 for overbought and -100 for oversold but can be changed by the user.
You can also select colors for the CCI and show zone line by selecting the appropriate box to bring up a color palette. The color for the average (median) determines the color for filled bands.
Theory
The CCI creates an index that measures the difference between current price change and an average price change. Deviations from the average should present trading opportunities and is essentially an indexed momentum study. CCI is relatively high when prices are far above their average. CCI is relatively low when prices are far below their average. In this manner, CCI can be used to identify overbought and oversold levels.
Interpretation
Most of the random fluctuations of the CCI should fall within a channel between negative 100% and positive 100%. The rules of trading are to buy long when CCI rises above +100%, and sell that position when CCI falls below +100%. Conversely, sell short when CCI falls below -100% then cover shorts when CCI rises above -100%. The idea is to buy strength and sell when that strength wanes.
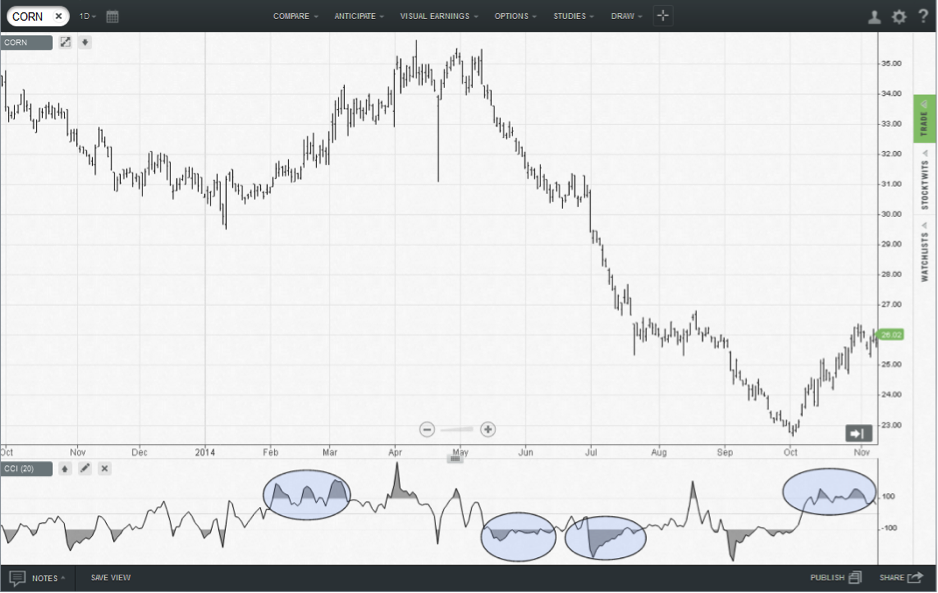
The chart for the Corn ETN shows a rally in early 2014 accompanied by high levels of CCI. While there were small dips back below the 100 level, the study maintained a long bias throughout. A small adjustment of the parameter from 20 to 25 would have kept the long position on using a strict interpretation of the rule to sell the long when CCI crossed back below 100. Traders can experiment with each market to find the ideal parameter for their style.
Later in the year, we can see two periods of low CCI indicating a short position. And finally in in October, the CCI moved back to the positive 100 zone to indicate a buy.
One alternate method for analysis is to close out long and short positions when the CCI crosses the zero line rather than when it re-enters the -100 to +100 zone. A more sensitive variation would be to close the position in a narrower -50 to +50 zone instead.
This study can also be used as an oscillator and as such can reveal divergences with price action. These occur more often with longer parameters. While we can see a slight higher low in CCI in October, it is clearer when using a 40 period CCI instead of the 20 period shown.
Math
CCI = Typical Price (TP) – (n-period simple moving average of TP)
(0.015 * Mean Deviation)
Typical Price = (high + low + close) / 3
Mean Deviation = ∑(absolute value of difference of TP and its N-pd simple moving average)
N

