The Basics
ADX/DMS stands for Average Directional Index and Directional Movement System. It can be used to identify the direction and strength of a trend.
Indicator Type
Trend finder
Markets
All cash and futures, not options
Works Best
All markets and time frames although this study can excel in determining if a visually flat market is starting to develop a trend.
Formula
 Directional Movement (DM) is defined as the largest part of the current period’s price range that lies outside the previous period’s price range. Each period will either be positive (larger range above previous range), negative (larger range below previous range) or zero if moves above and below the previous period’s range are the same or price stay within the previous day’s range.
The value of the Plus Directional Indicator (+DI) is the DM, if above the previous range) divided by the average true range. The value of the Minus Directional Indicator (-DI) is the DM (if below the previous range) divided by the average true range. Each period with have only one result, either plus, minus or zero.
Calculate the Average Directional Index by taking a simple moving average of the past +DI and -DI values. ChartIQ defaults to 14 periods.
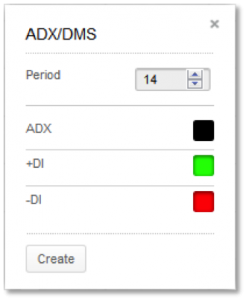
You can also select colors for the ADX, +DI and –DI lines by selecting the appropriate box to bring up a color palette. Green and red are often used for +DI and –DI, respectively.
Parameters
The period value in the DM calculation corresponds to trader preference in RSI, Stochastics and other Welles Wilder studies. Daily charts use values of 9 to 14 with 10 being Wilder’s original.
Theory
Most technical tools fall into one of two categories, oscillators and trend followers. RSI and Stochastics are examples of the former and moving averages and bands are examples of the latter. However, not all studies are effective in the different types of markets. Trend following studies often cause false signals, and hence losses, in flat or erratic markets. This study helps determine whether the market is in a trending mode and if so, how strong that trend is, so the proper technical tools can be applied.
The study seeks to find if the item spent more time above or below its previous period’s range. In this case, more time really means a bigger foray in one direction or the other. If moves higher start to accumulate even if closes are not really changing we get an idea that bulls are trying to move the item higher.
Interpretation
This system can be used as a filter for more traditional studies. If ADX is above 25-30, a trend following system can be used. If it is below 25-30 then an alternate should be used. Buy when +DM crosses above -DM and sell when the reverse occurs. When PDM is greater than MDM it means days when the trend was up outweigh the days when the trend was down (over the past “n” days). The greater the difference, the stronger the trend
High and rising ADX indicates a strong trend but not direction. +DM and –DM, not to mention visual inspection, tells the trader market direction. Low and falling ADX suggests whatever trend was in place has or will soon fail.
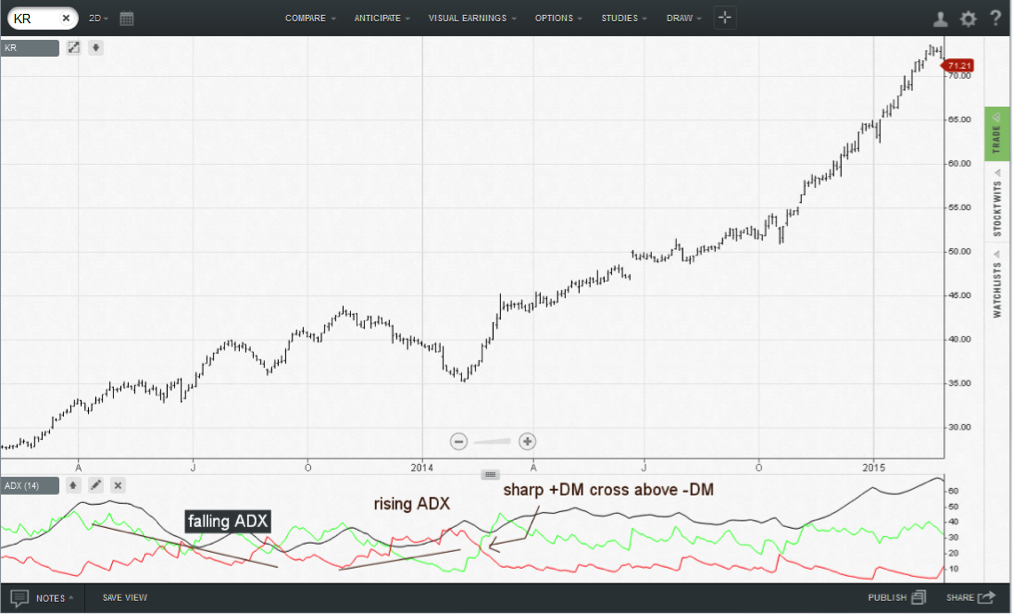
As we can see in the chart, Kroger was in a choppy rally in 2012 and a very strong rally in 2014. Even though prices were rising in 2014, ADX was falling to indicate the larger swings higher and lower within the trend were possible. Short-term traders could have taken advantage by trading around the trend but staying aware of the upward bias. Overbought and oversold oscillators would work well.
Later in the year, ADX started to rise as the movement each day took place farther outside the previous day’s range. –DM was above +DM and the stock had a sizeable correction. But with rising ADX, the cross of +DM back above –DM signaled a likely change in stock direction. ADX moved into very high ground and stayed there. Fighting the trend was a losing proposition for many months and trend following indicators would have worked quite well.
Should –DM move above +DM then this spectacular run could be in trouble and traders could look for overbought indicators reversing the trend.
Math
1) Directional Movement (DM) is defined as the largest part of the current period’s price range that lies outside the previous period’s price range.
- PDM = current high minus the previous high (called plus DM)
- MDM = current low minus the previous low (called minus DM)
- If PDM > MDM then MDM is set to zero
- If MDM > PDM then PDM is set to zero
- If current range lies within or is equal to the previous range then set both PDM and MDM to zero
2) Calculate the value of the Plus and Minus Directional Indicators:
PDI(n) = PDM(n) * 100 MDI(n) = MDM(n) * 100
ATR(n) ATR(n)
Where: n = Number of periods
ATR = Average True Range
3) Calculate the absolute value of the Directional Movement Index (DMI):
DMI = (PDI - MDI)
(PDI + MDI)
4) Calculate the Average Directional Movement (DMIA a.k.a. ADX):
DMIA(n) = Simple Moving Average of DMI

