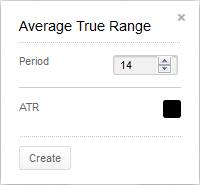
The Basics
ATR stands for Average True Range and incorporates the change from the previous close into calculating the periods range (volatility).
Indicator Type
Volatility measure
Markets
All cash and futures
Works Best
All market types in daily and weekly time frames, although it can be used intraday, as well.
Formula
The True Range is the largest of (high - previous close), (previous close - low) or (high – low).
Parameters
Theory
Although it can be used alone to help determine a market’s volatility, ATR is usually used as a qualifier in other indicators by, for example, adapting their parameters to a stock’s volatility. A stock experiencing a high level of volatility will have a higher ATR, and a low volatility stock will have a lower ATR.
In any time period, the range is often used as a measure of volatility. However, if the range occurred at a significantly different level than the prior range the jump up or down would not be factored in using simple range formulas. Intraday time frames do not see the jumping or gapping action as daily or weekly time frames so ATR would be less important there.
Interpretation
The Average True Range can be interpreted using the same techniques that are used with the other volatility indicators.
Volatility often moves from periods of high levels to periods of low levels, and back. We can find low volatility by comparing the daily range to a moving average of the range.
When the stock or commodity breaks out of a range, it is likely to continue moving for some time in the direction of the breakout. However, an opening gap would hide volatility when looking at the daily range. If a market jumps greatly at the open, the ensuing range may be very small even though volatility would clearly be high.
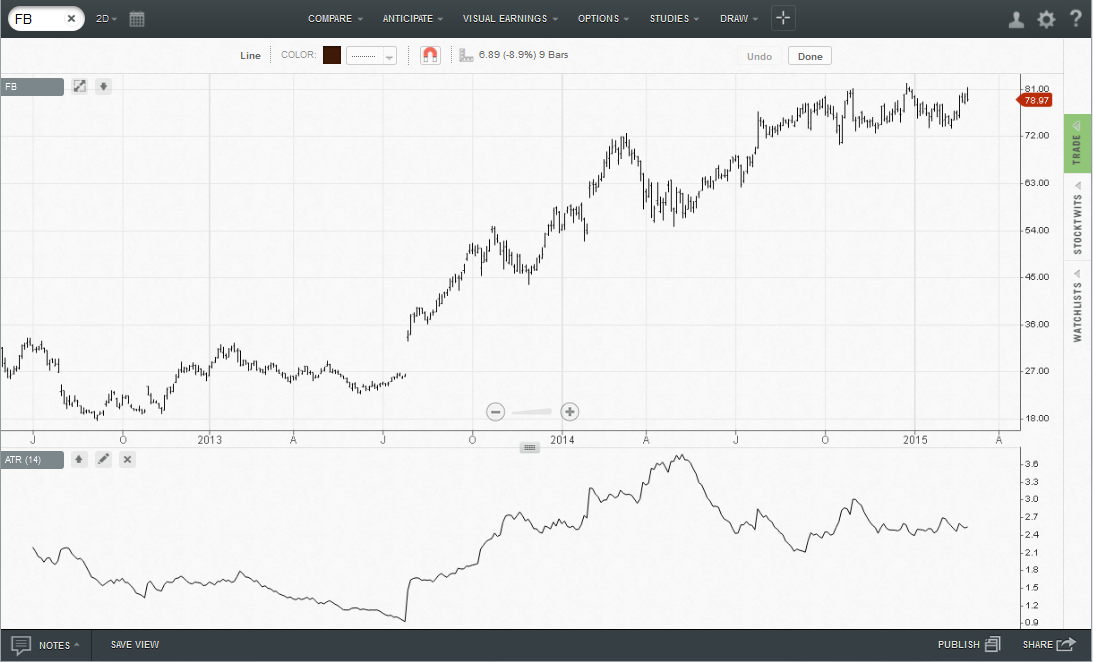
Facebook showed a prolonged trading range in early 2013 and ART sank to very low levels. When it jumped up in the summer, ATR jumped quickly to tell traders that the stock may be entering a period of high volatility and a new trend.
At high levels of volatility, it was not as clear that the stock would be needing a rest. However, it would have been possible to keep stops tighter to protect profits when ATR got to extreme levels.
Other studies could have been used to better time the profit taking, and ATR could have been the nudge traders needed to examine those other indicators.
Math
TR=True Range = defined as the greatest of the following:
- Current high minus the current low
- Current high minus the previous close (absolute value)
- Current low minus the previous close (absolute value)
ATR = simple moving average of TR


